Visibility Into Your Security Engine: CrowdSec + Grafana for SREs and Security Engineers

Most self-hosted infrastructure operators have two observability gaps that coexist without anyone noticing: they can tell you their CPU is at 40% and their disk is healthy, but they have no idea whether their systems are actively under attack — and no way to know whether their defenses are working when they are.
CrowdSec closes the detection gap. Grafana closes the visibility gap. Together, they give you something powerful: a security engine you can reason about like any other service in your stack.
This post covers what CrowdSec is, how to get its metrics into Grafana, and — more importantly — what those metrics mean from both an SRE and security engineering perspective. It's written from real experience wiring this up on self-hosted infrastructure, which means it includes the gotchas the docs don't warn you about.
What CrowdSec Is (and Why It's Different)
CrowdSec is a free, open-source security engine that reads your logs, detects attack patterns using a scenario-based rule engine, and issues banning decisions enforced by separate "bouncer" components at the firewall, reverse proxy, or application layer.
That architecture deserves a moment: the detection (CrowdSec agent) and the enforcement (bouncers) are separate processes. This is unusual and important. It means:
- Detection can cover multiple log sources from a single agent
- Enforcement can happen at multiple layers simultaneously — firewall and Caddy and your app
- Both can fail independently, creating a category of subtle failure modes that only observability surfaces
What makes CrowdSec worth paying attention to from an OSS perspective is the collaborative threat intelligence layer. When your instance bans an IP, that signal — stripped of anything personally identifying — is shared with the CrowdSec community. In return, your instance receives a blocklist of IPs the community has collectively identified as malicious. You're not just protecting yourself; you're contributing to a shared defense layer, and benefiting from it before attackers knock on your door.
The intelligence is crowd-sourced, the software is free, the architecture is composable. For anyone building infrastructure that doesn't depend on vendor lock-in, CrowdSec is the right kind of interesting.
The Metric Pipeline: CrowdSec → Grafana Alloy → Grafana Cloud
CrowdSec exposes a Prometheus metrics endpoint on port 6060. Grafana Alloy scrapes it and ships it to Grafana Cloud, where it lands in a Prometheus-compatible store you can query with PromQL.
The Alloy scrape config is minimal:
declare "crowdsec" {
  prometheus.scrape "crowdsec" {
    targets = [{ __address__ = "localhost:6060", app = "crowdsec" }]
    forward_to = [prometheus.remote_write.metrics_service.receiver]
    job_name   = "app-exporter"
  }
}
That's it. CrowdSec does the heavy lifting of producing meaningful metrics; you just collect and store them.
The metrics surface every layer of CrowdSec's pipeline. These are the v1.7+ names — earlier versions used different names without the _total suffix and with cs_buckets_* instead of cs_bucket_*:
| Layer | Key Metrics |
|---|---|
| Log ingestion | cs_filesource_hits_total, cs_dockersource_hits_total — lines read per source |
| Parsing | cs_parser_hits_total, cs_parser_hits_ok_total, cs_parser_hits_ko_total |
| Detection | cs_bucket_created_total, cs_bucket_overflowed_total, cs_bucket_underflow_total, cs_bucket_pour_total |
| Decisions | cs_active_decisions, cs_alerts |
| LAPI | cs_lapi_route_requests_total, cs_lapi_bouncer_requests_total, cs_lapi_machine_requests_total |
| AppSec WAF | cs_appsec_reqs_total, cs_appsec_inband_parsing_time_seconds |
One important caveat for v1.7+: cs_lapi_route_requests_total no longer includes a status code label, so you cannot calculate an HTTP error rate from Prometheus metrics alone. The dashboards work around this — more on that below.
Before You Can See Anything: Log Acquisition
This is the section the documentation undersells, and where most people get stuck.
CrowdSec is useless if it isn't reading your logs. The acquisition configuration (acquis.yaml) tells CrowdSec where to find them. Two source types matter for container-based deployments:
source: docker— reads a container's stdout/stderr via the Docker socketsource: file— tails a log file on the filesystem
These are not interchangeable, and the difference matters. Caddy sends its system logs (startup, TLS, errors) to stdout — but its HTTP access logs go to a file. Configure source: docker for Caddy expecting access logs and CrowdSec reads system logs, fails to parse them as HTTP access records, and shows a 0% parser success rate with no errors anywhere obvious.
The correct acquisition config for a Caddy + AppSec setup:
---
# HTTP access logs — written to file, not stdout
source: file
filenames:
  - /var/log/caddy/access.log
labels:
  type: caddy

---
# AppSec WAF — receives forwarded requests from the Caddy bouncer
source: appsec
listen_addr: 0.0.0.0:7422
appsec_config: crowdsecurity/appsec-default
labels:
  type: appsec
For Caddy to write HTTP access logs, you need an explicit log directive in each site block. The easiest way to manage this at scale is a reusable snippet in the main Caddyfile:
(access_log) {
    log {
        output file /var/log/caddy/access.log {
            roll_size 100mb
            roll_keep 5
        }
        format json
    }
}
Then import access_log in each site. Note: the global log {} block in Caddy's options configures the server process log — startup, TLS events — not HTTP access logs. They are separate, and process logs will fail to parse as Caddy access records.
Verifying the Pipeline
Once acquisition is configured, verify the full pipeline is alive with a single curl:
curl -s http://localhost:6060/metrics | grep -E "cs_filesource|cs_parser_hits"
A healthy output looks like:
cs_filesource_hits_total{source="/var/log/caddy/access.log"} 847
cs_parser_hits_total{source="/var/log/caddy/access.log",type="file"} 847
cs_parser_hits_ok_total{source="/var/log/caddy/access.log",type="file"} 821
cs_parser_hits_ko_total{source="/var/log/caddy/access.log",type="file"} 26
cs_filesource_hits_total tells you CrowdSec is reading the file. cs_parser_hits_ok_total tells you it's successfully parsing the content. The small number of _ko entries is normal — they're typically Caddy's server process logs mixed into the same file if you have the global log block configured.
If cs_filesource_hits_total is missing entirely, CrowdSec isn't reading the file at all. Check whether the file path is correctly mounted into the container and whether any lines have been written since the last CrowdSec restart — it starts at EOF, not from the beginning.
The Two Dashboards: What They Tell You
Security Overview

The overview dashboard is your first stop when something feels wrong. It answers operational questions.
The screenshot above is from a real homelab deployment. 28.1K active bans, 2 bouncers confirmed pulling decisions, 100% parser rate — all visible at a glance. The Top Decision Reasons table tells the rest of the story: every ban originated from CAPI, the community intelligence feed. Not a single local detection. This infrastructure was defended before any attacker touched it.
"Are we being attacked right now?"
The Active Decisions and Alert Rate by Scenario panels answer this directly. Active decisions is a gauge — it shows how many IPs are currently banned. The more useful signal during an active incident is New Ban Rate and Alert Velocity: these show the rate of change, not the static count. A flat active decision count with a spiking alert rate means the attack is still incoming but bans are expiring as fast as they're being issued.
"Is our protection actually working?"
Check the Active Bouncers stat and the Bouncer Activity section. This is a critical failure mode: CrowdSec can be issuing bans, but if no bouncer is pulling those decisions, nothing is being enforced at the network level. The protection appears operational while attackers walk straight through. The Bouncer Not Pulling alert fires specifically on this.
"Which attacks are we seeing most?"
The Top Triggering Scenarios bar chart gives you the answer for the selected time range. SSH brute-force (crowdsecurity/ssh-bf), web scanning (crowdsecurity/http-scan-uniques_404), and credential stuffing are typically at the top for public-facing infrastructure. The scenario breakdown tells you which threat actors are targeting your stack — which informs what services you need to harden, not just block.
"Is CrowdSec healthy as a service?"
The Engine Health row adds the operational view missing from most CrowdSec dashboards. The LAPI Error Rate stat uses absent() as a proxy: it shows 0% when CrowdSec is up (metrics present), and 100% when it's unreachable. This is an intentional design choice — v1.7 removed per-status-code labels from LAPI metrics, making granular HTTP error rate tracking impossible from Prometheus alone. The panel is explicit about this rather than silently showing misleading data.
The LAPI P99 Latency panel is more useful anyway: slow LAPI responses indicate contention or resource pressure before errors start appearing, giving you earlier warning.
Log Processing & Pipeline
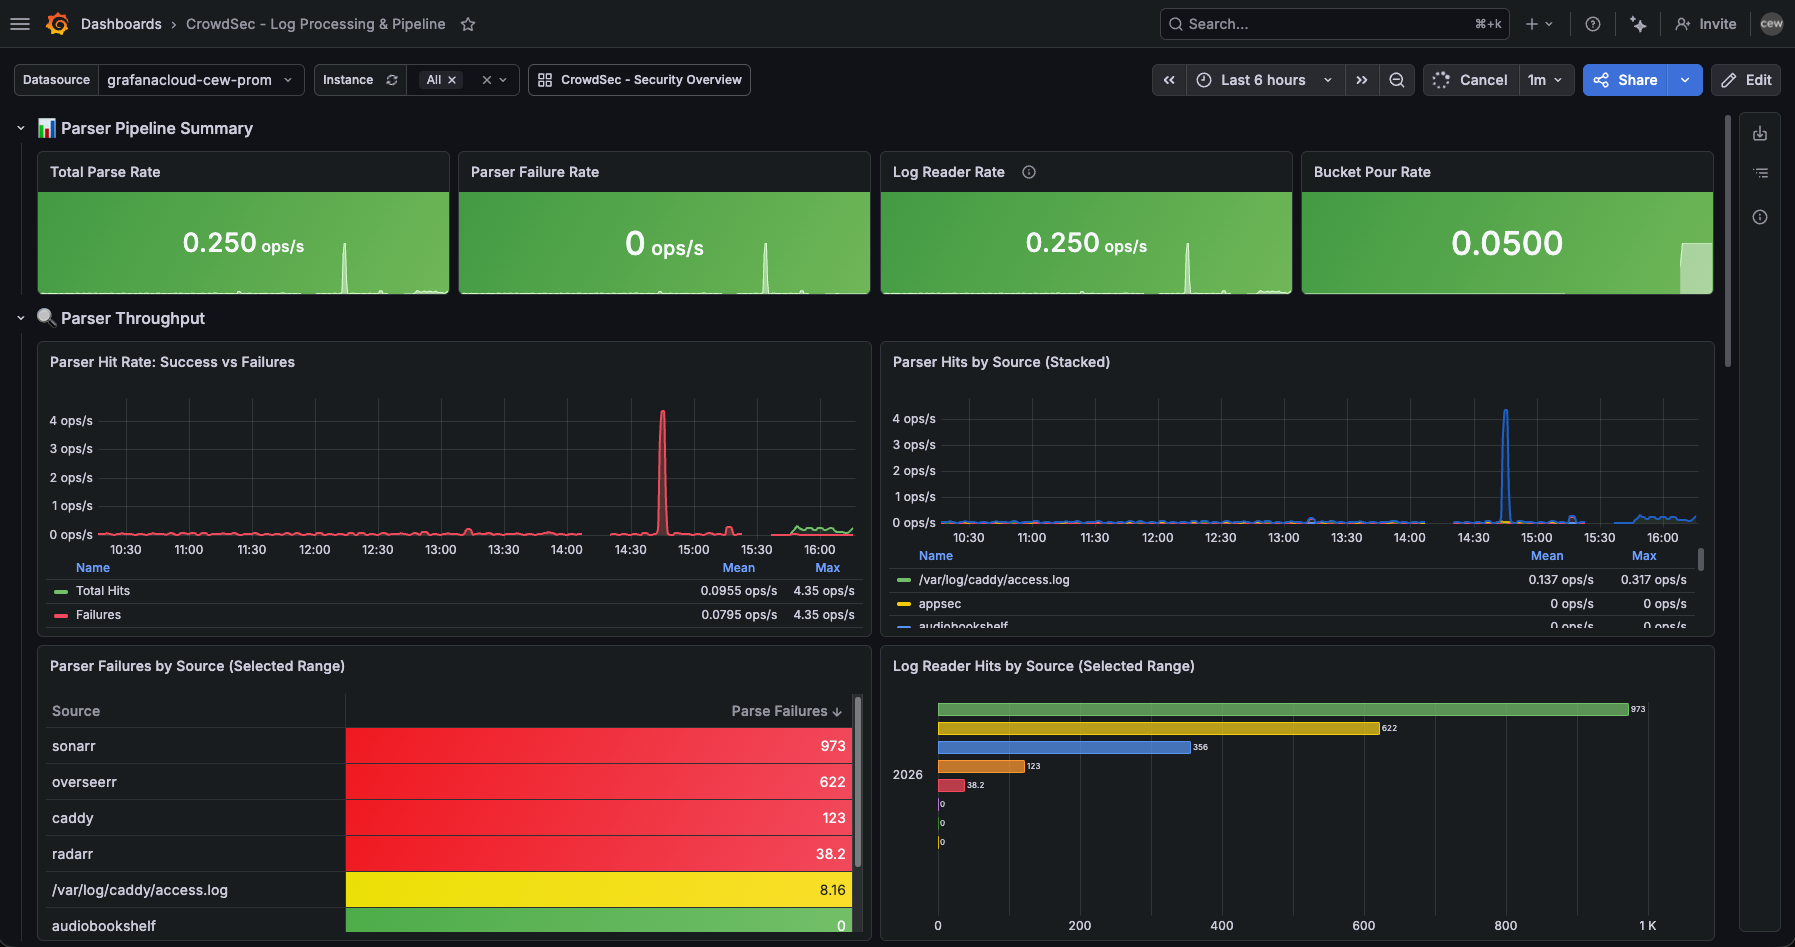
This dashboard is for understanding why detection is or isn't working. It's the SRE dashboard for the detection engine itself.
"Are all our log sources being parsed?"
The Parser Hits by Source panel breaks down throughput by log source. If sshd suddenly drops off the stacked area chart, either the SSH daemon stopped logging or CrowdSec lost access to the log file. Either way, you've lost visibility into one of your most important attack surfaces.
The Parser Failures by Source table in the screenshot above shows Sonarr and Overseerr at the top of the failure list — 973 and 622 failures respectively. These are media services with no CrowdSec parser for their log format. CrowdSec is reading them but can't match a scenario to the output. This is expected and harmless, but the dashboard makes it visible. Without this table, those failures are invisible noise; with it, they're a known quantity you can choose to address (write a custom parser) or deliberately ignore.
"How effective are our detection scenarios?"
The Detection Efficiency section answers this. For each scenario:
efficiency = overflows / events_poured * 100
A scenario with 0.1% efficiency is processing a lot of traffic but rarely triggering — it might be well-tuned, or too strict. A scenario with 80% efficiency means nearly every event crossing its initial filter also crosses the threshold — either perfectly calibrated for the attack pattern, or dangerously aggressive and generating false positives.
"Is the parser pipeline keeping up?"
At high traffic volumes, verify that the parse rate tracks the reader rate. If cs_filesource_hits_total is climbing but cs_parser_hits_ok_total isn't, events are being dropped or rejected somewhere in the pipeline.
Alert Rules: From Reactive to Proactive
Dashboards tell you what's happening when you look. Alerts tell you when to look. Seven rules cover the critical failure modes of a CrowdSec deployment.
Service & Infrastructure Alerts
CrowdSec — Service Down (critical, fires after 2m)
Uses up{job="app-exporter", app="crowdsec"}. noDataState: Alerting ensures this fires even if the metrics endpoint disappears entirely — which is exactly what happens when the process crashes. This is the most important alert: a silent CrowdSec failure means no detection and no new bans while everything appears fine.
CrowdSec — Parser Failure Rate High (warning, fires after 5m)
Parser failures are the silent blind spot. Your service is running, but it can't read the evidence. This fires after application upgrades that subtly change log format — the parser regex no longer matches and the log source goes dark without anything obvious breaking. It also fires during the log acquisition misconfiguration scenario above, making it a useful diagnostic during initial setup.
CrowdSec — LAPI Error Rate High (warning, fires after 5m)
Since v1.7 doesn't expose HTTP status codes in LAPI metrics, this alert uses absent() as a proxy: it fires when no LAPI metrics are visible at all. It's a coarser signal than a true error rate, but it catches the most important case reliably.
Enforcement Alerts
CrowdSec — No Active Bouncers (critical, fires after 5m)
The most dangerous silent failure mode. Detection works, bans are issued, nothing is enforced. Fires when no bouncer has pulled decisions recently.
CrowdSec — Bouncer Not Pulling (warning, fires after 15m)
Per-bouncer staleness. A bouncer can be registered and appear healthy but stop pulling updates — its enforcement list grows stale while new threats accumulate in the unread decision queue.
Detection & Connectivity Alerts
CrowdSec — Alert Surge (warning, fires when >20 alerts in 5m)
The "something is happening" alert. Tune the threshold to your baseline — a busy public server might need this set higher. The annotation includes direct links to cscli investigation commands.
CrowdSec — Machine Agent Stale (warning, fires when a machine hasn't pushed in >5m)
An agent that's stopped pushing events has gone dark. Attacks against that host won't be detected or shared with the fleet. This surfaces the failure before it becomes a security incident.
The SRE Lens: CrowdSec as a Service
From an SRE perspective, CrowdSec is just another service in your stack — with reliability requirements, failure modes, and an SLI/SLO story.
The SLI that matters most is decision pipeline availability: is the full path from log line to enforced ban functional? It has four stages, any one of which can silently fail:
- Log source → CrowdSec agent (reader —
cs_filesource_hits_total) - Agent → parser (parser success rate —
cs_parser_hits_ok_total / cs_parser_hits_total) - Parser → LAPI (machine push freshness —
cs_lapi_machine_requests_total) - LAPI → bouncer (bouncer pull freshness —
cs_lapi_bouncer_requests_total)
The dashboards and alert rules in this repo are designed to surface failures at each stage independently. Stage 1 is the most frequently overlooked: a perfectly configured parser is worthless if CrowdSec isn't reading the right file.
The SLO worth defining: 95% of alerts should result in an enforced decision within 60 seconds. You can't measure this exactly with the available metrics, but you can approximate it by monitoring that bouncers are pulling at least every 30 seconds and that LAPI error rates stay below 1%.
A realistic parser success rate for a mixed-traffic site — legitimate users, monitoring probes, scanner traffic — is 85–95%. Getting to 100% is possible but rarely worth the effort. The _ko entries are typically log format edge cases or system messages that slipped into the access log, not meaningful signal. Consistently below 70%: start with acquisition configuration.
The Security Lens: Threat Intelligence, Not Just Block Lists
The Top Decision Reasons table in the overview dashboard tells you why IPs are being banned, not just how many. crowdsecurity/ssh-bf tells you someone is brute-forcing SSH. crowdsecurity/http-probing tells you you're being scanned for vulnerabilities. crowdsecurity/http-bad-user-agent tells you automated tools are probing your web services.
Each tells a different story about the threat actor and the appropriate response beyond the ban:
- SSH brute-force → consider moving SSH to a non-standard port, enforce key-only auth, audit your authorized_keys
- HTTP probing → check your publicly exposed service inventory, ensure unnecessary services aren't exposed
- Credential stuffing → enable MFA on any web services with authentication
The dashboard isn't a counter of bad things. It's a map of your threat landscape.
The community blocklist adds another dimension: you can distinguish between decisions that originated locally — IPs that attacked your systems — versus decisions from the CrowdSec CTI feed — IPs flagged by the community globally. The Active Decisions by Origin panel surfaces this. A healthy deployment has both. Local detections show your systems are actively defending; community decisions show you're benefiting from collective intelligence before attackers target you. In practice, the CAPI feed tends to dominate (thousands of pre-emptive bans), while local detections are smaller but higher signal — these are IPs targeting your specific infrastructure.
The AppSec component adds a third layer: WAF-style inspection of live HTTP requests forwarded by the bouncer. Where the file-based pipeline detects attacks after parsing logs, AppSec intercepts requests in flight — blocking exploit attempts before they reach your application, and feeding those signals back to the detection engine.
Storing This in Git
All configuration covered in this post — the Alloy scrape module, both Grafana dashboards, and all seven alert rules — lives in a single GitHub repository:
crowdsec-o11y/
├── alloy/modules/crowdsec.alloy      # Prometheus scrape config for CrowdSec
├── dashboards/
│   ├── crowdsec-overview.json        # Security overview + engine health
│   └── crowdsec-log-processing.json  # Pipeline analysis + detection efficiency
└── alerts/
    └── crowdsec-alerts.yaml          # 7 Grafana alert rules
Dashboards are imported through Grafana UI or the provisioning API. Alert rules are in Grafana's native provisioning YAML format, ready to import with a single API call. Each alert rule includes description annotations with direct investigation commands, so whoever is on call doesn't need to know CrowdSec internals to start debugging.
The full setup — from installing CrowdSec through deploying Alloy and pushing metrics to Grafana Cloud — takes about 30 minutes on a new host. Budget another 30 minutes for acquisition configuration: verifying cs_filesource_hits_total is incrementing, confirming cs_parser_hits_ok_total is climbing, and checking that your bouncer is actually pulling decisions. That second 30 minutes is the difference between a CrowdSec deployment that looks healthy and one that actually is.
What You Actually Get
When it's all wired up:
- Detection coverage across your fleet, with metrics proving which hosts are sending data and which aren't
- Enforcement verification that confirms bans are being applied at the network layer, not just issued and ignored
- Attack intelligence that tells you what threat patterns are active against your infrastructure right now
- Operational visibility into the health of the CrowdSec pipeline itself — parser quality, LAPI health, bouncer freshness
- Proactive alerting that fires before an investigation is needed, not after
None of this requires proprietary tools, vendor contracts, or SaaS lock-in. CrowdSec is Apache-licensed. Grafana Alloy is Apache-licensed. The dashboards and alerts in this repo are yours to adapt.
For anyone running self-hosted infrastructure — homelab to small production — this is about as close to enterprise-grade security observability as you can get with open-source software. The fact that it also feeds and benefits from a global threat intelligence community is what makes it different from just another log parser with a web UI.
Configuration lives in colinedwardwood/crowdsec-o11y. The CrowdSec Alloy module, both dashboards, and all seven alert rules are ready to deploy.