Monitoring a (Cogeco) Sagemcom Modem with Prometheus
Four consecutive days of unexplained connectivity loss. Each event took the whole path down. Restoring service meant walking to the modem and power-cycling it.
The LED was green between failures. The ISP app had nothing useful. Bridge-mode management at 192.168.100.1 is a GUI, not a monitoring surface so I had no history, no signal information, and no way to tell whether the line was noisy, if the modem was thermal-throttling, or if the firmware had simply wedged.
That is a diagnostic black box that I was determined to fix.
The gap
Consumer DOCSIS gear exposes a lot of state internally. Downstream SNR. Upstream transmit power. Correctable and uncorrectable codewords. Channel lock. Uptime. Temperature. CPU and memory. Almost none of that is available as a scrape target.
Off-the-shelf Sagemcom exporters exist for other ISPs. Cogeco's F3896 firmware does not speak the documented F3896 REST URLs. Those paths redirect back to the GUI. The working interface is the authenticated JSON-RPC endpoint the web UI already uses: POST /cgi/json-req.
Existing clients fail for a second reason that only shows up after login. Passing session-options.nss as the string "gtw:tr181" returns a session. Every subsequent getValue then fails with XMO_UNKNOWN_PATH_ERR. The GUI sends namespaces as a structured object list. The exporter has to do the same.
What gets scraped
The interesting questions map cleanly onto TR-181 paths under Device/Docsis/CableModem and Device/DeviceInfo:
| Question | Signal |
|---|---|
| Did the modem restart? | Uptime decrease; reboot count |
| Is RF quality degrading? | Downstream SNR, channel power, lock state |
| Is the modem screaming upstream? | Upstream transmit power approaching ~51 dBmV |
| Is the coax corrupting frames? | Rising uncorrectable codewords |
| Is the box itself unhealthy? | Temperature, thermal throttle, CPU, free memory |
| Is the LAN handoff intact? | Ethernet link up, negotiated speed, errors |
Those are the series the exporter emits. GUI reachability and optional public TCP probes sit beside them so a dead modem, a failed API scrape, and a broader path failure are distinguishable.
Exporter shape
cogeco-sagemcom-exporter is a single Python file. Standard library only. Small Alpine image. Read-only container. No reboot, reset, or write methods — scrape and logout only.
Each scrape:
- Checks whether the management GUI answers.
- Opens one JSON-RPC session with the SHA-512 challenge-response the GUI uses.
- Batches every TR-181 path into a single
getValuerequest. - Logs out in a
finallyblock so orphan sessions do not exhaust the modem's concurrent login limit. - Exposes Prometheus text on
:9488/metrics.
Batching matters for these boxes. They have weak CPUs and tight session pools. One round-trip per scrape is the difference between a quiet collector and a device that locks you out of your own admin UI.
Configuration is via environment variables: modem address, MODEM_USERNAME / PASSWORD, optional toggles for Ethernet and system sensors, and a list of TCP probe targets. Use MODEM_USERNAME rather than USERNAME — shells on macOS already export USERNAME as the local account name.
Dashboards and alerts
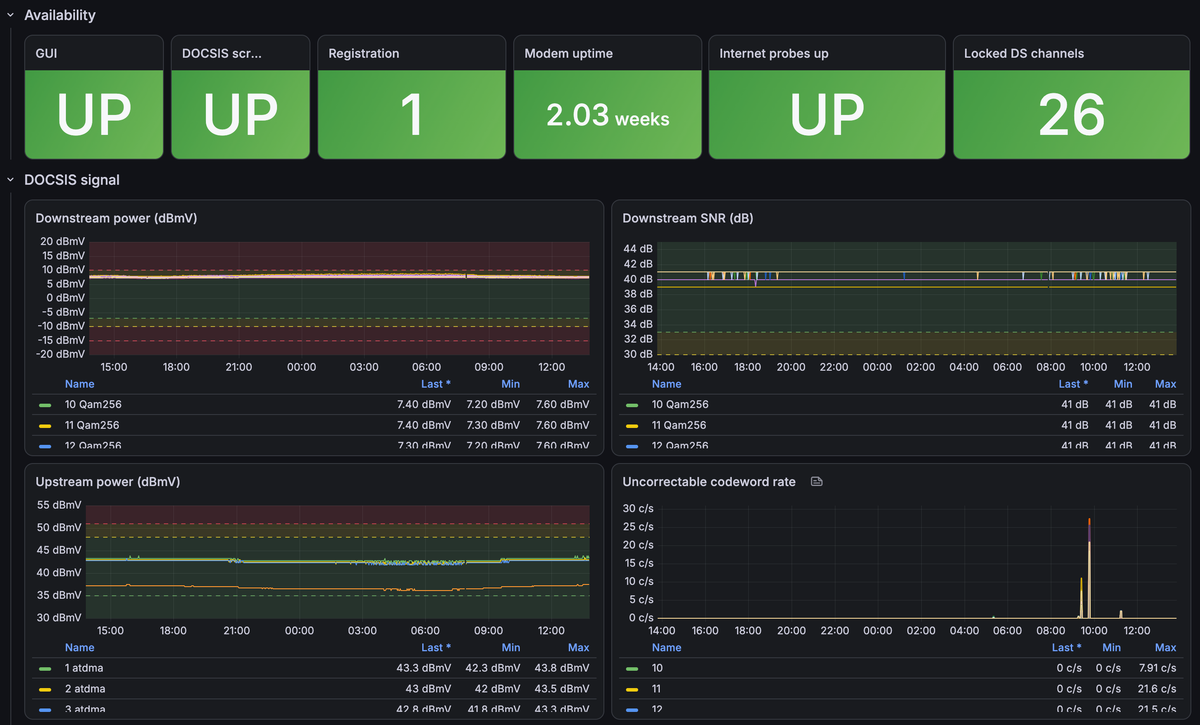
The repo ships a Grafana dashboard and a rule group aimed at the failures that actually matter:
- Modem GUI unreachable
- DOCSIS scrape failed while the GUI is still up
- Internet path probes down
- Modem restarted (uptime delta)
- Downstream SNR below 33 dB
- Upstream power above 51 dBmV
- Uncorrectable codewords rising
- Channel unlocked
SNR and upstream power are the early warning pair. Uncorrectables are the packet-loss confirmation. Uptime resets give you a timestamp to align with WAN loss. Path probes without a modem-side signal usually mean something upstream of the coax — treat them as a symptom, not a ticket text for the ISP.
What this doesn't do
A healthy scrape does not prove Cogeco's plant is fine. Public TCP probes can fail because a single destination is filtering you. Channel tables can look clean while something else in the path is broken.
What the exporter does give you is history. When the next silent failure happens, you can answer whether SNR collapsed, upstream power climbed, codewords spiked, the box rebooted, or the API simply stopped answering.
Code, OpenAPI/OpenRPC notes for the HTTP and JSON-RPC layers, dashboard, and alerts: